0%

For farmers and international buyers, selecting reliable Farm Wind Energy Solutions requires more than comparing turbine prices. A productive system must match local wind speed, land conditions, electrical demand, and maintenance capacity. A small dairy may need a compact turbine for refrigeration and water pumping. A large agricultural estate may require several machines, stronger foundations, and grid coordination.

James F. Manwell, a respected wind-energy researcher and co-author of Wind Energy Explained, states, “Wind energy is the process by which wind is converted into a useful form of energy.” This simple definition carries practical weight. Buyers should examine how each solution converts wind into dependable electricity under real farm conditions. A glossy brochure cannot replace twelve months of wind measurements.

The best options may include small horizontal-axis turbines, hybrid solar-wind systems, and modular machines for remote fields. Details matter. Check the anemometer height, rotor diameter, tower certification, battery warranty, and replacement-part access. Ask who will inspect the blades after a storm. Ask again.

This guide compares ten Farm Wind Energy Solutions for global buyers, focusing on output, installation demands, lifecycle cost, safety, and service support. It also recognizes uncomfortable realities. Wind resources can vary sharply across neighboring farms. Soil can complicate construction. Some projects underperform because expectations were too optimistic. Careful feasibility studies, transparent performance data, and qualified local engineers create a stronger buying decision. Even then, no system is perfect. That is worth remembering.
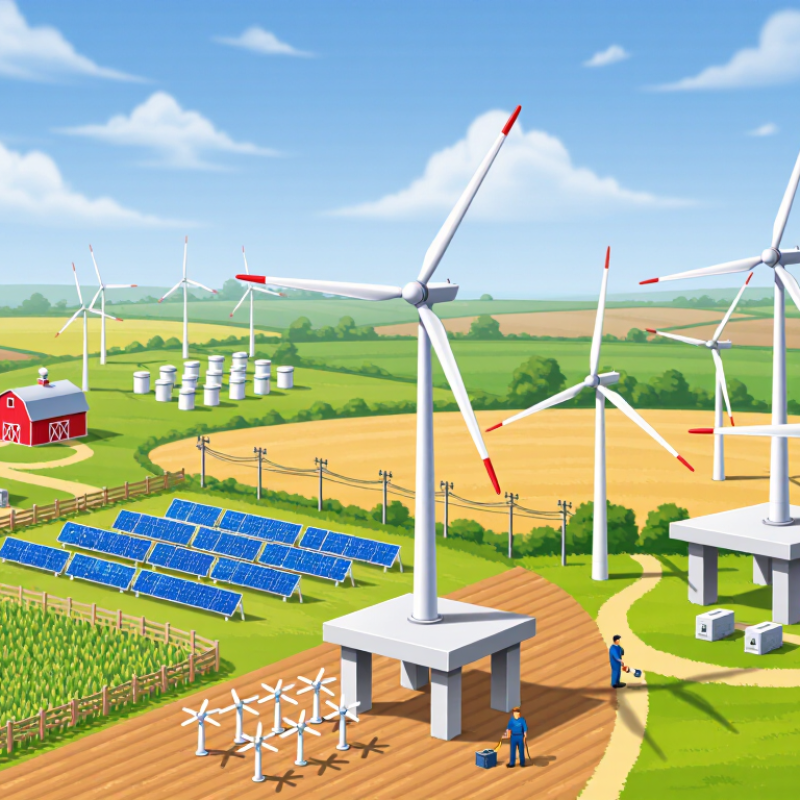
10 Best Farm Wind Energy Solutions for Global Buyers

Farm Wind Energy Basics: Capacity Factors Commonly Reach 35–45%

10 Best Farm Wind Energy Solutions for Global Buyers

Farm wind energy works best when production estimates reflect the real landscape, not just a sales brochure. Capacity factors commonly reach 35–45% on well-sited farms with steady wind. This figure describes annual output compared with maximum possible output. A 100-kilowatt turbine at 40% capacity factor may generate about 350,000 kilowatt-hours yearly. Actual results depend on rotor size, tower height, turbulence, maintenance, and grid availability.

Tips: Measure wind at the proposed turbine height for at least twelve months. Review seasonal patterns, because winter peaks may not match irrigation demand. Check nearby trees, buildings, and ridgelines. Small errors in siting can reduce output significantly. Ask for production estimates using conservative wind data.

Farm owners should compare energy yield, service access, noise limits, foundation costs, and battery needs. A taller tower may capture smoother wind, but transport and installation become more difficult. Smaller turbines can suit isolated barns, yet they may produce less energy than expected during calm periods. The uncomfortable truth is that a strong average wind speed does not guarantee reliable power every day. Local technical surveys and independent financial checks remain essential. Planning can still be imperfect. That is why measured data matters.

Ten Solution Types: From 1–20 kW Turbines to Utility-Scale Wind Farms

Farm wind projects now range from a single 1 kW turbine to utility-scale clusters exceeding 1 GW. The Global Wind Energy Council reported 117 GW of new wind capacity in 2023. That record hides major differences between sites, budgets, and grid access. Site conditions decide.

For rural buyers, ten solution types cover most needs:

1–20 kW turbines for farms and remote buildings
20–100 kW turbines for larger agricultural loads
100–500 kW machines for community facilities
500 kW–1 MW units for commercial farms
1–5 MW turbines for industrial users
5–10 MW onshore turbines for strong wind corridors
turbines above 10 MW for major developments
wind-solar battery systems
wind-diesel replacement microgrids
utility-scale wind farms with transmission connections

Each option needs measured wind data, not only a promising weather map. A temporary anemometer can reveal turbulence from trees, barns, and uneven ground.

The International Energy Agency identifies wind power as central to global renewable growth, but performance still depends on local engineering. Buyers should compare annual energy yield, tower height, maintenance access, noise limits, foundation geology, and grid studies. IEC 61400-based testing improves technical confidence.

However, certification does not remove every risk. A small turbine may appear simple, yet poor siting can destroy its economics. Utility projects face delays from permits, transmission queues, and crane availability.

My practical view is cautious: model conservative wind speeds, budget spare parts, and question every optimistic production forecast. Forecasts can be wrong. That matters.

Technology Screening: IEC 61400-2, Rotor Design, Towers, and Controls

Global farm wind buyers should screen technology before comparing price. IRENA’s Renewable Capacity Statistics 2024 recorded more than 1,000 GW of global wind capacity by the end of 2023. Yet farm projects face stronger turbulence, weaker grids, and limited maintenance access. IEC 61400-2 provides a practical starting point for small wind turbine safety, structural loads, testing, and design verification. Certification does not remove every site risk.

Rotor design deserves close attention. A larger swept area can capture more energy, but it also increases thrust, noise, and tower loads. Check the power curve against local wind speeds, turbulence intensity, and seasonal direction changes. Tower selection should consider fatigue, foundation soil, lightning protection, corrosion, and crane access. Controls must manage overspeed, braking, yaw response, and grid faults. GWEC’s Global Wind Report 2024 reported about 117 GW of new wind capacity installed globally in 2023, but farm-scale performance still varies sharply by site.

Tips: Request independent load calculations and measured power-curve data. Compare annual energy estimates using conservative wind assumptions. Inspect the controller’s failure mode. A safe shutdown matters more than a clever dashboard. Field data is often incomplete, so question perfect forecasts. A spreadsheet can still mislead.

Global Buyer Economics: LCOE, Payback, and 20–25-Year Project Life

Global Buyer Economics: LCOE, Payback, and 20–25-Year Project Life

For farm wind projects, the lowest purchase price rarely delivers the lowest lifetime cost. Global buyers should compare levelized cost of energy, or LCOE, across the complete 20–25-year project life. Include turbine supply, civil works, transport, installation, insurance, land preparation, grid connection, and scheduled maintenance. A cheaper machine may require stronger foundations or more frequent service in harsh conditions.

Site data shapes the result. A turbine producing power at 7.5 meters per second can outperform a larger unit on a weaker site. Buyers should request at least one year of wind measurements, then review seasonal production, wake losses, downtime, and curtailment assumptions. Small changes matter. A five-percent energy shortfall can materially extend payback.

Cash flow deserves equal attention. Calculate payback using realistic tariffs, debt costs, taxes, replacement reserves, and foreign-exchange exposure. In my project reviews, optimistic spreadsheets often ignore crane access, spare-parts delays, or low winter production. That is risky. Ask for independent energy assessments and warranty terms that remain practical after year ten. A 20-year model should test component replacement, while a 25-year model should examine repowering or controlled retirement. No forecast is perfect. Recheck it before signing.

10 Best Farm Wind Energy Solutions for Global Buyers - Global Buyer Economics: LCOE, Payback, and 20–25-Year Project Life
Rank Farm Wind Solution Typical Rated Capacity Best-Fit Market / Site Indicative CAPEX
(USD/kW)
Capacity Factor LCOE
(USD/MWh)
Simple Payback
(Years)
Project Life Main Economic Advantage
1 Utility-Scale Onshore Wind Farm 3–6 MW per turbine High-wind plains, open agricultural land, grid-connected projects 1,200–2,000 35–50% 30–65 6–10 20–25 years Lowest cost per kilowatt-hour at strong wind sites
2 Medium-Scale Agricultural Wind Cluster 250 kW–2 MW per turbine Large farms, cooperatives, rural industrial zones 1,500–2,500 25–40% 45–90 7–12 20–25 years Balances scale, local ownership, and manageable grid requirements
3 Small Farm Wind Turbine 50–250 kW Remote farms, irrigation systems, dairy and livestock operations 2,000–4,000 20–35% 80–160 9–16 20–25 years Reduces diesel purchases and improves energy resilience
4 Wind–Solar Hybrid Farm System 100 kW–5 MW wind plus solar PV Sites with complementary daytime solar and seasonal wind 1,100–2,200 35–55% combined 35–75 6–11 20–25 years Higher land and grid utilization with smoother annual output
5 Wind Farm with Battery Storage 500 kW–5 MW plus 1–4 hours of storage Weak-grid areas, peak-price markets, microgrids 1,700–3,500 30–50% 60–120 8–14 20–25 years
battery: 10–15 years
Adds dispatchability, peak shaving, and backup capability
6 Direct Wind Power for Irrigation 30–500 kW Water-pumping farms and agricultural processing sites 1,800–3,800 20–35% 70–150 7–13 20–25 years Avoids electricity or diesel costs where pumping demand is flexible
7 Community-Owned Farm Wind Project 1–20 MW total project size Agricultural cooperatives and shared rural investment projects 1,300–2,300 30–45% 40–80 7–12 20–25 years Shares revenues, land income, and energy benefits among participants
8 Low-Wind-Site Turbine System 100 kW–4 MW with tall tower and large rotor Moderate-wind farms with limited high-wind locations 1,500–2,600 25–40% 50–105 8–14 20–25 years Captures more energy at lower wind speeds through rotor and tower design
9 Remote Hybrid Wind–Diesel Replacement 50 kW–2 MW wind plus controls and backup generation Off-grid farms, islands, mining and remote agricultural sites 2,000–4,500 25–45% 90–220 5–11 20–25 years Can be economical where delivered diesel costs are high
10 Repowered Agricultural Wind Site 1–6 MW replacement turbines Existing wind sites with usable roads, foundations, and grid access 900–1,700 35–55% 25–55 5–9 20–25 years Uses existing infrastructure while substantially increasing energy yield
Economic assumptions: Indicative 2025–2026 global benchmarks in constant USD. LCOE includes capital recovery, operations and maintenance, balance-of-plant costs, and typical financing assumptions, but excludes subsidies, taxes, transmission upgrades, and exceptional permitting costs. Simple payback is based on annual energy savings or contracted revenue and does not include financing costs, depreciation, tax benefits, curtailment, or residual value. Actual results depend on wind speed, turbine height, local labor, grid connection, electricity prices, and project financing.

Compliance and Siting: Grid Codes, Noise Limits, and 116.6 GW Added in 2023

Compliance begins before a turbine reaches the port. The Global Wind Energy Council recorded 116.6 GW of new wind capacity in 2023, proving strong demand but also increasing scrutiny. Buyers should request grid-code evidence for frequency ride-through, voltage support, reactive-power control, and remote dispatch. These requirements differ sharply between countries and even between transmission zones. A familiar specification may still fail locally.

Siting decisions need measured evidence, not attractive maps. A 12-month wind campaign, terrain modelling, shadow-flicker checks, and nearby-house surveys can expose costly surprises. The World Health Organization’s 2018 Environmental Noise Guidelines identify 45 dB Lden as a conditional recommendation for wind-turbine noise. Local authorities may apply stricter nighttime limits, often near 35–45 dB(A) at sensitive buildings. Small errors matter. One overlooked ridge can change sound propagation.

Professional buyers should compare certified acoustic models with post-construction monitoring plans. Grid studies should include weak-grid conditions, curtailment rules, and protection settings. The International Renewable Energy Agency reported wind power remained a major contributor to renewable expansion in 2023, but global statistics do not remove local compliance risks. A project can be technically sound and still face delays because community consultation started too late. That weakness is easy to underestimate. Suppliers should disclose assumptions, uncertainties, and corrective options rather than presenting perfect forecasts.

FAQS

Why should buyers screen wind technology before comparing prices?

A low purchase price may hide stronger foundations, difficult transport, or frequent maintenance. Compare lifetime performance, not only the invoice. Site conditions can change the result sharply.

What should buyers check about rotor design?

Review swept area, thrust, noise, and tower loads together. A larger rotor may capture more energy, but it can increase structural stress. Check the power curve against local wind speeds and turbulence.

How much wind data is useful before choosing a turbine?

Request at least twelve months of measured wind data. Review seasonal production, wind direction, turbulence, wake losses, and downtime. One attractive month proves very little.

What tower details deserve close attention?

Check fatigue strength, foundation soil, lightning protection, corrosion resistance, and crane access. A tower may look suitable while its foundation remains expensive. That risk is easy to miss.

What should the control system safely manage?

It should manage overspeed, braking, yaw response, and grid faults. Ask how the controller behaves after a sensor or communication failure. Safe shutdown matters more than a clever dashboard.

How should buyers compare the project’s lifetime cost?

Use LCOE across a 20–25-year project life. Include equipment, civil works, transport, installation, insurance, land preparation, grid connection, and maintenance. Also test taxes, debt costs, replacement reserves, and currency changes.

How can buyers test whether the payback forecast is realistic?

Use conservative wind assumptions and realistic electricity tariffs. Include crane delays, spare-parts shortages, winter production, curtailment, and component replacement. A five-percent energy shortfall can extend payback materially. Recheck the spreadsheet.

What grid and site compliance evidence should buyers request?

Request proof of frequency ride-through, voltage support, reactive-power control, and remote dispatch. Confirm local noise limits, shadow-flicker risks, terrain effects, and protection settings. Requirements may differ between nearby grid zones.

How should noise and community risks be handled?

Conduct acoustic modelling, nearby-house surveys, and post-construction monitoring. Some sensitive buildings may face nighttime limits near 35–45 dB(A). Start community consultation early. Late objections can delay an otherwise sound project.

Conclusion

Farm Wind Energy Solutions offer practical pathways for farms, rural businesses, and larger developers seeking reliable renewable power. With typical capacity factors of 35–45%, modern systems can support on-site electricity use, agricultural operations, storage, or grid supply. The market includes options ranging from compact 1–20 kW turbines for distributed generation to utility-scale wind farms designed for regional power delivery. Selecting the right solution requires evaluating wind resources, energy demand, rotor design, tower height, control systems, and the safety principles outlined in IEC 61400-2.

For global buyers, project economics should be assessed through levelized cost of energy, expected payback, financing conditions, maintenance requirements, and a typical operating life of 20–25 years. Successful deployment also depends on local grid codes, permitting, setback rules, noise limits, environmental considerations, and site access. With 116.6 GW of new wind capacity added globally in 2023, careful technology screening and compliance planning remain essential for achieving dependable performance and long-term value.


Charlotte

Charlotte

Charlotte is a professional marketing specialist with a strong understanding of the company’s products, customers, and industry landscape. With a thoughtful, research-driven approach, she transforms complex product information into clear, practical, and engaging content that helps readers make......